From survey to decision,
with the rigor of research.
Questionnaire design, omnichannel collection, quantitative and qualitative analysis, reporting — a complete platform, from hypothesis to decision.


A research-grade standard of rigor, serving organizations that decide on evidence.
One environment, from hypothesis to report.
Every stage of your study lives in Qualixa — no more juggling five different tools.
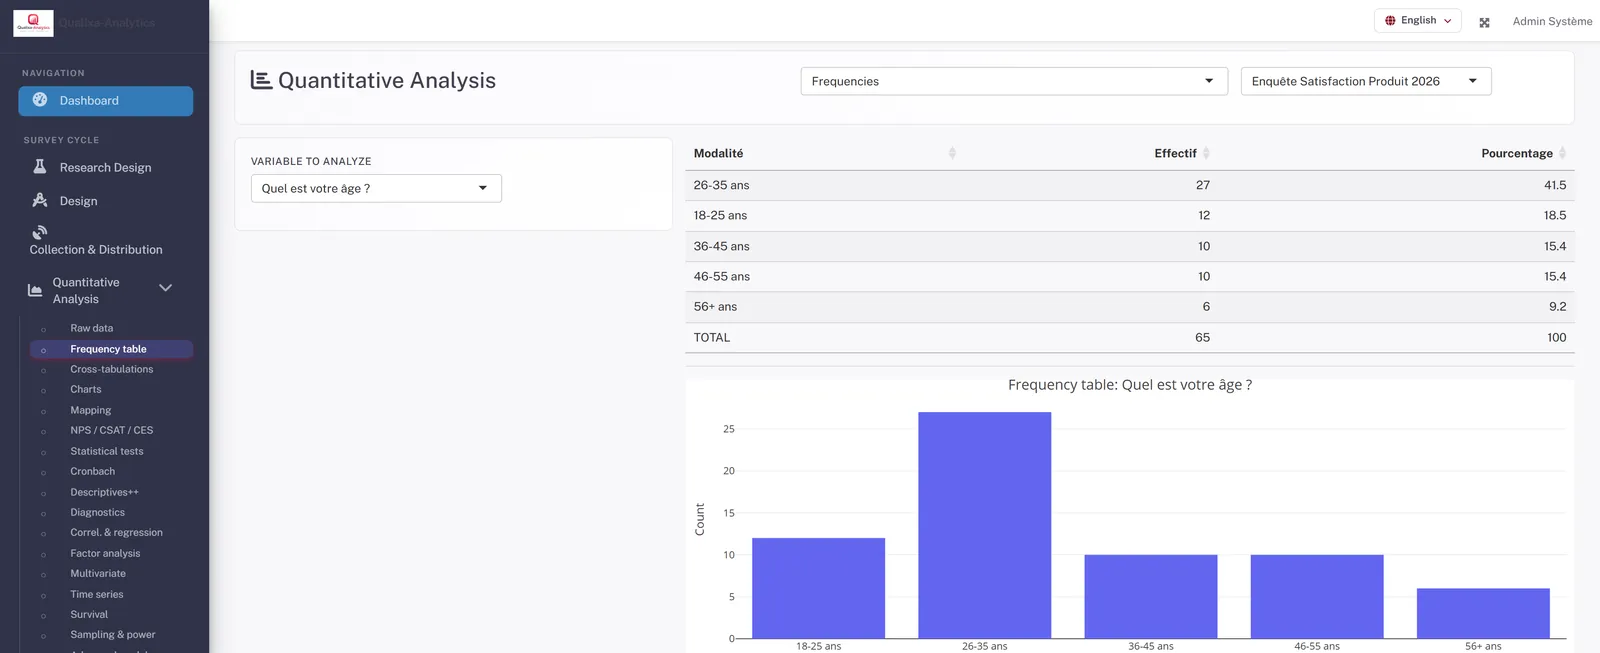
Quantitative analysis that goes all the way to inference.
Beyond one-way tables, cross-tabulate your variables and let the platform run the statistical tests — with plain-language interpretation.
- Cross-tabulations and Pearson's Chi² test
- Automatic interpretation of significance
- Interactive charts, ready for the report
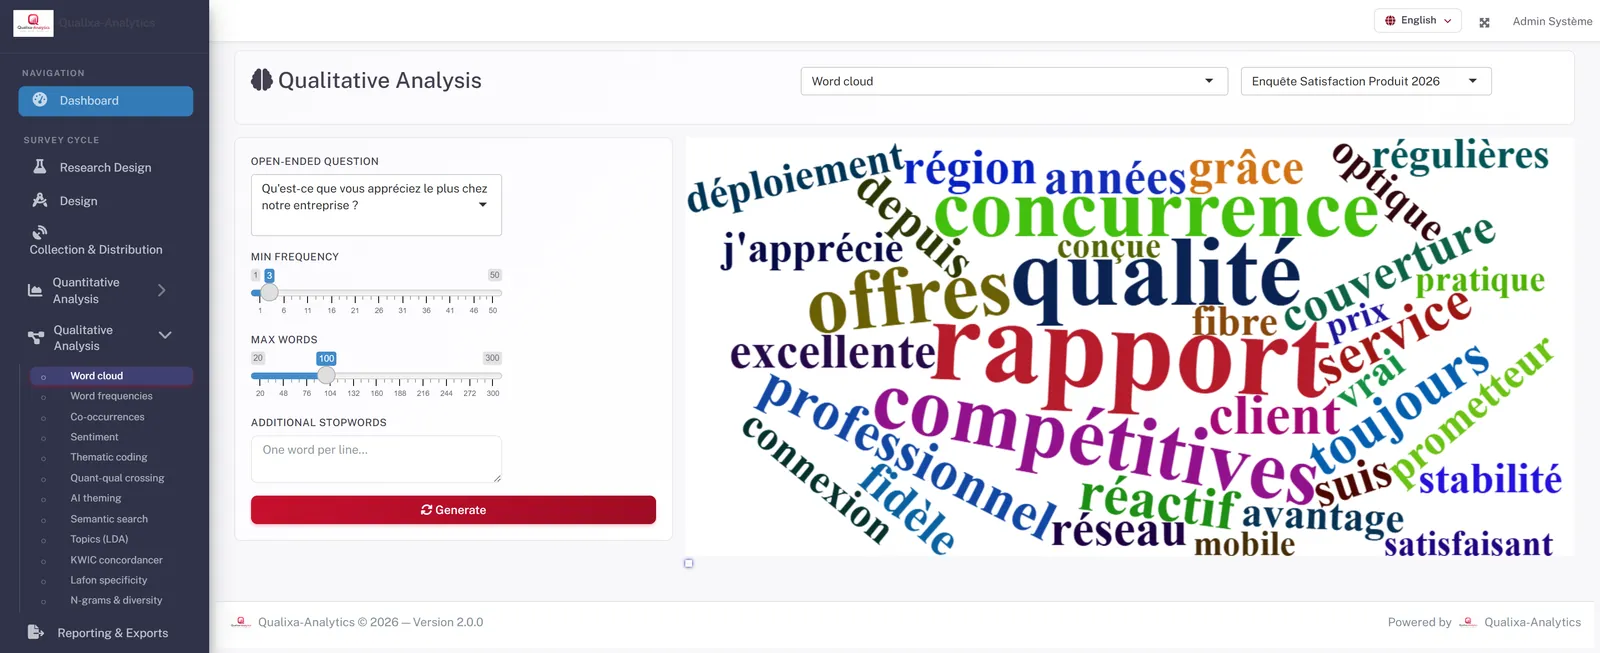
Structured qualitative analysis, AI-assisted.
Make your open-ended responses speak: dominant themes, tone, structure — while staying in control of coding, with inter-rater agreement measurement.
- Word clouds, frequencies, co-occurrences
- Sentiment analysis and thematic coding
- Private AI — your verbatims never leave for a third-party service
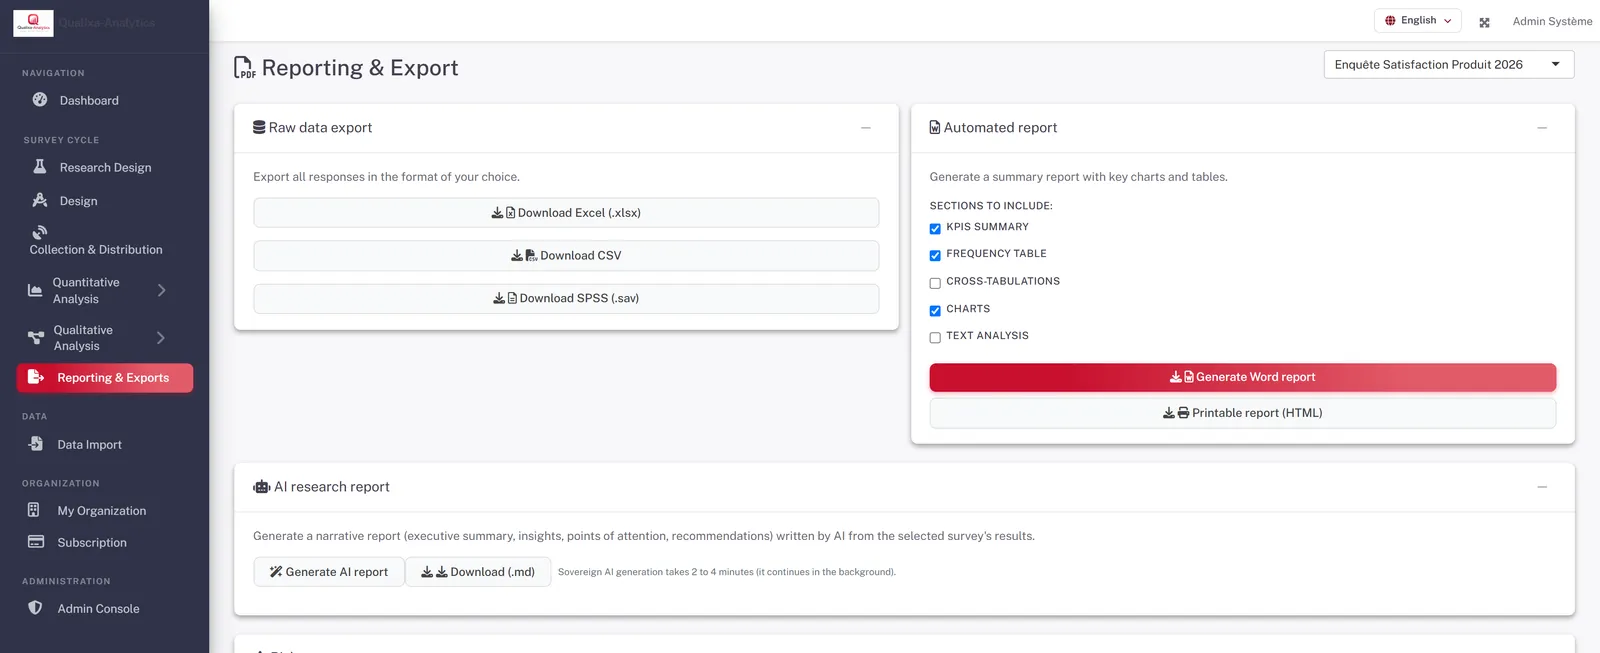
From result to report, in one click.
Put together a PDF, Word or PowerPoint summary report with the sections that matter, and export your data to the tools you already use.
- PDF, Word or PowerPoint report, with a built-in statistical appendix
- Excel, CSV and SPSS exports
- Import your existing data, no re-entry required
Every stage, a tool built for it.
Complete coverage of the survey cycle, without compromising on depth.
Research design
Formulate your hypotheses (H1 / H0) and link them to your questions via the Hypotheses × Questions matrix. Your study is framed before the first response even comes in.
Questionnaire design
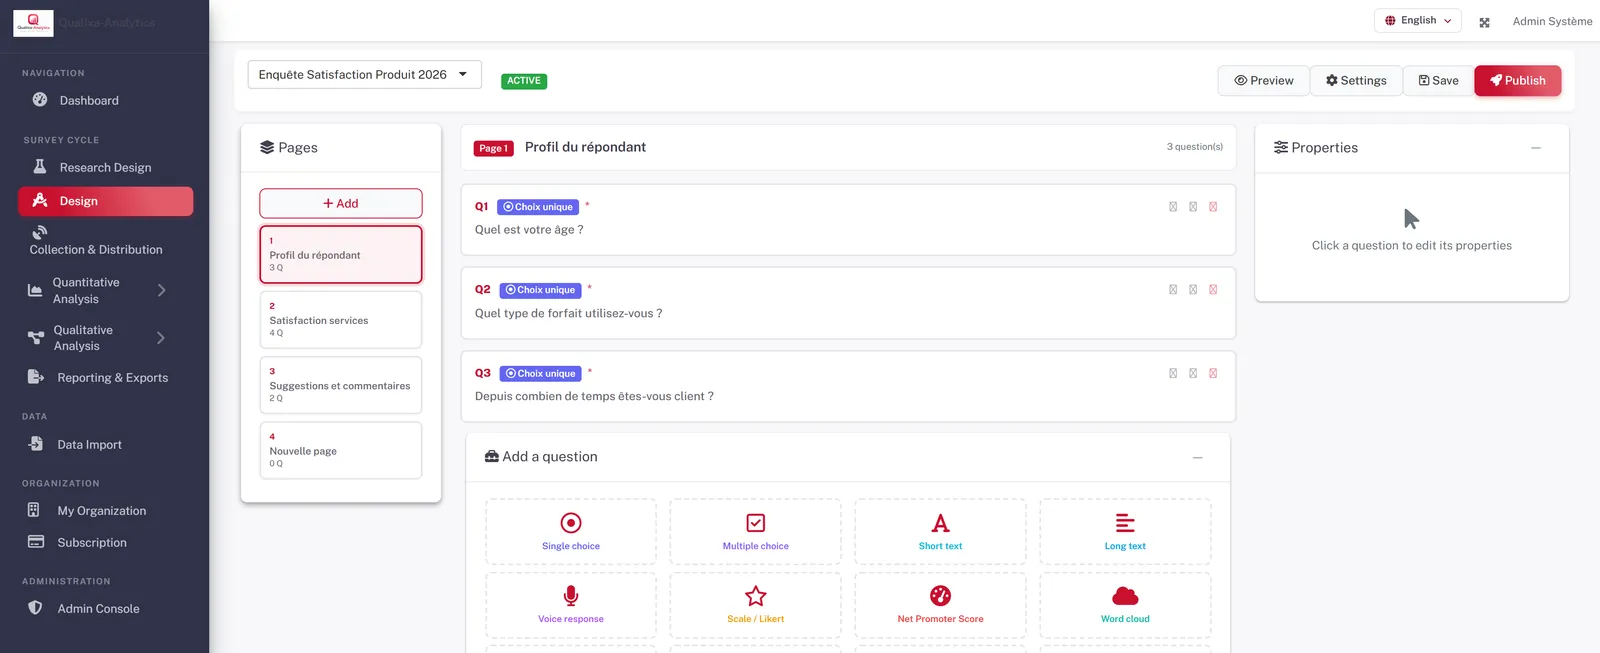
A visual, no-code builder. 13 question types — from multiple choice to AI-transcribed voice responses, plus Likert scales, NPS, matrix and ranking — with conditional logic, multiple pages and live preview.
Collection & distribution
Distribute via public link, QR code, email campaign, SMS or WhatsApp. Automatic reminders for non-respondents, per-profile quotas, and live completion tracking.
Offline field collection
Your interviewers collect in the field with no connection; responses are queued and sync automatically as soon as the network returns.
Quantitative analysis
From one-way tables to inferential tests — Chi², ANOVA, regressions, ACP — with automatic significance interpretation and interactive charts.
Qualitative analysis & AI
Word clouds, co-occurrences, sentiment, thematic coding and inter-rater agreement. The AI runs privately: your verbatims never leave for a third-party service.
Reporting & exports
A one-click Word or PowerPoint summary report, a print-ready PDF, each with its statistical appendix, wave-over-wave comparison and a research report computed from the results — plus Excel, CSV, SPSS and data-dictionary exports.
Data import
Load your existing datasets (Excel, CSV, SPSS) and analyze them right away, with no need to recreate a survey.
Multi-tenant & governance
Multiple organizations, strictly isolated. Super-admin, administrator, staff and participant roles, plus a complete audit log.
Dashboards
Build your own views: key indicators, scales, cross-tabulations, strongest links and open-ended answers, with filters applied to the whole dashboard.
Continuous monitoring
Answers kept up to date over time: each respondent keeps a personal link and comes back to write a new answer, without ever erasing the previous one. Every change creates a version, validated before it takes effect; dated snapshots and alerts on answers due for review.
Observatory
What moved from one period to the next: favourable ratings, NPS, breakdowns and means, month by month or quarter by quarter. Every change is tested — established, worth watching or not established — and the movements of each followed respondent can be read.
Results explained
Scales, distributions and cross-tabulations come with a plain-language reading and their practical relevance: share of favourable and unfavourable opinions, Cohen's effect size, and a statistical appendix for the control analyses. In French, the reading of scales and cross-tabulations is written by a private AI, then checked automatically before it is shown.
13 question types, one visual builder.
From multiple choice to AI-transcribed voice responses — build the exact questionnaire your fieldwork needs, by drag and drop.
Integrates with your tools, not the other way around.
Import, export and connect Qualixa to your information system — in the formats your teams already use.
Start from a proven framework.
Templates that frame your study — objective and structure — which you complete with your own questions before distributing.
Customer satisfaction (CSAT)
Overall perception, effort and NPS recommendation.
Net Promoter Score (NPS)
A short measure to track customer recommendation.
HR engagement
Employee engagement, atmosphere and outlook.
Product onboarding
Feedback from new users on their first steps.
Training evaluation
Kirkpatrick model levels 1 & 2: reaction and learning.
Market research
Understand needs, barriers and purchase intent.
A lab's statistical library, in a single interface.
Coverage of 38 analysis modules — from descriptive to inferential, multivariate and latent models — plus structured qualitative analysis. Academic rigor, without the complexity of code.
Descriptive statistics
Hypothesis testing
Associations & structure
Modeling & prediction
Reliability & robustness
Qualitative analysis
Mixed methods
Link each hypothesis to the questions that test it, triangulate quantitative and qualitative data, and keep your entire study structured from start to finish.
A continuous process, from hypothesis to decision.
Research design
Set out your hypotheses and link them to your questions.
Design
Build the questionnaire in the visual builder.
Collection
Distribute and track responses in real time.
Analysis
Explore quantitatively and qualitatively.
Reporting
Generate standardized reports and exports.
Decision
Conclude with evidence-based results.
A survey, from A to Z.
The hypothesis
"Does satisfaction depend on plan type?" The hypothesis is formulated in Research Design, then linked to the questions that will test it.
The design
A 14-question questionnaire across 6 pages — scales, multiple choice and open-ended questions — assembled by drag-and-drop, then published.
The collection
Distribution via public link and email campaign. 145 responses collected, 100% completion, tracked in real time.
The quantitative analysis
The plan × satisfaction cross-tabulation, then the Chi² test: χ² = 12,76, p = 0,39 — non-significant relationship. Satisfaction does not depend on plan type.
The qualitative analysis
Open-ended responses run through the word cloud and sentiment analysis: "quality," "network" and "coverage" stand out, in a predominantly positive tone.
The report & the decision
A Word summary report generated in one click, ready to share. The decision rests on evidence, not impressions.
Designed for every survey profession.
One platform, adapted to your fieldwork and your research questions.
Customer satisfaction & experience
Measure satisfaction and recommendation, identify pain points, and track their evolution over time.
HR & workplace climate studies
Survey engagement, quality of work life and internal climate — with full confidentiality.
Marketing & market research
Test a concept, segment your targets, and understand expectations and purchase barriers.
Academic research
Conduct your fieldwork, test your hypotheses, and produce publication-level analyses.
Public sector & observatories
Conduct public surveys and evaluate your policies, with protected data.
Health & training
Administer validated questionnaires and scales, with reliability and agreement measurement.
One tool, where five used to be needed.
No more stitching together a spreadsheet for data entry, statistical software, a survey tool, a qualitative module, and manual formatting.
The usual patchwork
- One tool to collect, another to analyze
- Manual exports and imports between software
- Advanced statistics reserved for experts
- Open-ended responses handled separately, by hand
- Time-consuming report formatting
- Data scattered across multiple clouds
With Qualixa
- Design, collection, analysis and reporting in one place
- Your data flows through with zero re-entry
- 130+ statistical methods, with automatic interpretation
- Quantitative and qualitative in the same study file
- Word report (or printable HTML) generated in one click
- Your data protected — never sold, never shared
Rigor shouldn't be a luxury.
Qualixa brings together the methodological soundness of research and the simplicity of a modern tool — no juggling between software, no writing a line of code, and never exposing your data to a third-party service.
Rigor
Research-grade methods, with plain-language interpretation.
Confidentiality
Your data protected — never sold, never shared.
Simplicity
Accessible to teams, with no prior technical expertise required.
Your data stays protected and under your control.
Built for organizations where confidentiality isn't optional: encryption, strict per-organization isolation, an audit log and GDPR compliance. Your data is never sold or shared; for institutions, the platform can also be deployed on your own infrastructure.
SSO SAML / Shibboleth
Sign in through your institution's directory, for institutions. Set up during onboarding.
Dedicated hosting
Your data stays on dedicated infrastructure, never sold or shared.
Multi-tenant isolation
Strict data partitioning by organization.
Audit log
Full traceability of actions and access.
Consent & retention
Consent capture, configurable retention period and automatic purge.
Data-subject rights
Access, portability, anonymization and erasure of a respondent's data, in one action.
Anonymized exports
Share your data with no re-identification risk (k-anonymity).
Flexible deployment
SaaS or dedicated on-premise deployment (Institution).
You're never alone.
From deployment to upskilling, a long-term partnership.
Guided deployment
Supported on-premise installation, tailored to your environment.
Team training
Hands-on onboarding for design, analysis and reporting.
Responsive support
A team that listens, to clear blockers quickly.
Regular updates
New methods and improvements, continuously.
Methodological guidance
Support in choosing tests and interpreting results.
Service commitments
Defined service levels for Institution deployments.
Plans for every level of ambition.
Two grids, academic and enterprise — flexible billing, dedicated infrastructure.
Academic
Try the platform: one survey, no analytics.
- 1 survey
- 200 responses / year included
- 1,000 invitation e-mails / year
- 1 user
- Collection only — no statistical analysis
For students: theses, capstones and research work.
- 6 surveys
- 1,200 responses / year included
- 6,000 invitation e-mails / year
- 1 user
- All analysis modules + AI
- Word / SPSS / Excel exports
For a researcher: surveys with full analytics.
- 15 surveys
- 5,000 responses / year included
- 25,000 invitation e-mails / year
- 1 user
- All analysis modules + AI
- Word / SPSS / Excel exports
For a research team, up to 10 accounts.
- 40 surveys
- 10,000 responses / year included
- 50,000 invitation e-mails / year
- 10 users
- All analysis modules + AI
- Word / SPSS / Excel exports
Faculty, university or campus: tailored deployment.
- Custom volumes
- Shared or dedicated instance
- SSO / LDAP, API & webhooks
- Training & onboarding
Enterprise
For a consultant or independent activity.
- 20 surveys
- 2,000 responses / year included
- 10,000 invitation e-mails / year
- 1 user
- All analysis modules + AI
- Word / SPSS / Excel exports
For an SME or research agency, up to 10 accounts.
- 60 surveys
- 10,000 responses / year included
- 50,000 invitation e-mails / year
- 10 users
- All analysis modules + AI
- Word / SPSS / Excel exports
For a company: high volumes and a team.
- 200 surveys
- 25,000 responses / year included
- 125,000 invitation e-mails / year
- 20 users
- All analysis modules + AI
- Word / SPSS / Excel exports
Institution or public sector: dedicated deployment.
- Custom volumes
- Shared or dedicated instance
- SSO / LDAP, API & webhooks
- Training & onboarding
New account: 10-day free trial — 1 survey, 100 responses.
Built by ViviD LogiC Software.
Qualixa-Analytics brings together the methodological rigor of research and the simplicity of a modern tool. The platform is designed and operated with particular care for the confidentiality of your data: it is never sold or shared. Our conviction: reliable, usable data, within everyone's reach.
What teams ask us most.
How is our data protected?
Your data is hosted on dedicated infrastructure and never sold or shared — encryption, multi-tenant isolation and a complete audit log. For institutions, a dedicated deployment on your own infrastructure is possible.
How far does the statistical analysis go?
Beyond one-way tables: hypothesis testing (Chi², t, ANOVA), correlations, ACP, regressions, time series, survival analysis, econometrics and meta-analysis — 38 modules, with automatic interpretation.
Is the qualitative analysis really AI-assisted?
Yes — thematic coding, sentiment and synthesis rely on a private AI, hosted on dedicated infrastructure. Your verbatims are never sent to a third-party service.
Is the platform multilingual?
It's available in 8 languages, including Arabic in right-to-left script (RTL) — interface and questionnaires.
Do you need statistical skills?
No. An assistant guides you to the test suited to your data, and every result comes with a plain-language interpretation.
Can several people collaborate on a study?
Yes. Each organization has roles — administrator, staff, participant — a strictly isolated workspace, and a complete audit log.
Can the platform be customized to our brand colors?
Yes. The Institution deployment allows for visual customization and hosting dedicated to your organization.
Survey vocabulary, made clear.
Key terms in methodology and statistics, explained simply.
- Survey
- A structured data collection method among a sample of respondents.
- Likert scale
- A graduated scale (from "Strongly disagree" to "Strongly agree") measuring an attitude.
- Net Promoter Score (NPS)
- Propensity to recommend, measured from 0 to 10, then summarized into a single score.
- CSAT
- Customer Satisfaction — satisfaction level measured immediately after an interaction.
- CES
- Customer Effort Score — the effort perceived by the customer to get an answer or a service.
- One-way table
- Distribution of responses to a question, in counts and percentages.
- Cross-tabulation
- Joint distribution of two questions, to identify possible relationships.
- Chi² test
- A statistical test of independence between two categorical variables.
- p-value
- The probability of observing such a difference by pure chance; below 0,05, the difference is considered significant.
- ANOVA
- Analysis of variance — compares the means of several groups.
- Correlation
- A measure of the relationship between two numeric variables, ranging from −1 to +1.
- ACP
- Principal component analysis — summarizes many variables into a few axes.
- Regression
- A model explaining or predicting a variable from one or more others.
- Cronbach's alpha
- An index of the internal consistency of a measurement scale, from 0 to 1.
- Sample
- A subset of the population surveyed, ideally representative.
- Verbatim
- A respondent's free-text response, quoted exactly as given.
- Coding
- Assigning themes or categories to open-ended responses.
- Cohen's Kappa
- A measure of agreement between two coders, beyond what chance alone would produce.
- Sentiment analysis
- Automatic classification of a text's tone: positive, neutral or negative.
- Mixed methods
- Combining quantitative and qualitative approaches within the same study.
- Multi-tenant
- An architecture that strictly isolates each organization's data.
- RTL
- Right-to-left — a layout direction running right to left, notably for Arabic.
Everything you need to master the platform on your own.
User guide
Step-by-step onboarding, from your first survey to the final report.
ViewDocumentation
Detailed reference for every feature and every method.
ExploreVideo tutorials
The 5 modules in video: design, distribute, analyze, export and write — in under ten minutes.
WatchMethodological glossary
Key concepts in surveys and statistics, explained simply.
DiscoverGive your surveys a research-grade dimension.
Discover how Qualixa structures your studies, from hypothesis to report, without ever exposing your data.
Our partners
Networks, institutions and solutions that support us.